Revenue
$33,000Down 48.4% on AugustFree profit and loss (P&L) dashboard for small businesses
Know your numbers.
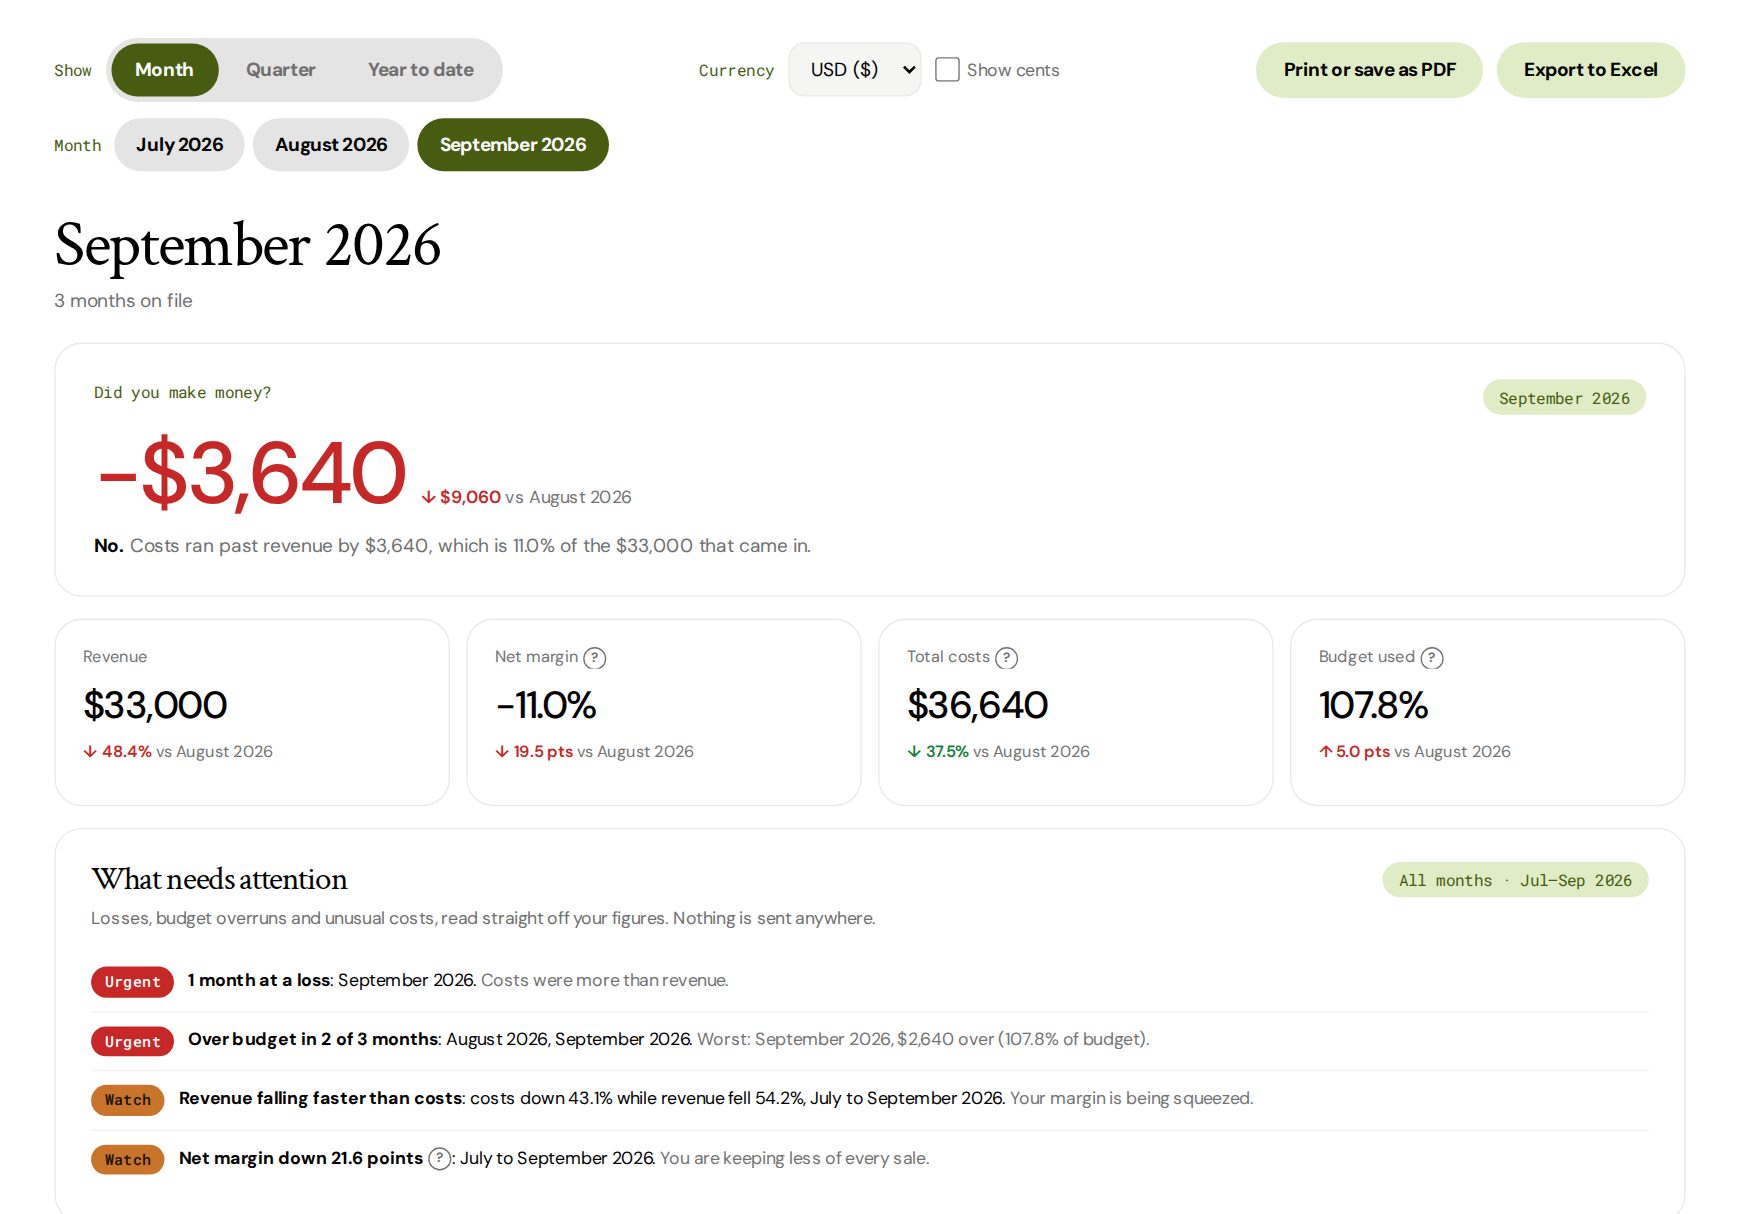
At a glance
Revenue, costs and budget from the figures you already have. Copy your monthly totals from QuickBooks, Xero or your own spreadsheet, or snap a photo of a supplier invoice, and see the month. We're opening soon: join the waitlist to get in first. The dashboard works without an account; log in to keep your figures on any computer.
No payment, no spam. We'll only email you about FinDash. Free. Your spreadsheet is read in your own browser.
About
What is FinDash?
FinDash (findash.tech) is a free web app that turns a small business's monthly figures, from an Excel or CSV spreadsheet or a photo of a supplier invoice, into a profit and loss (P&L) dashboard of revenue, costs, profit and budget vs actual, with plain-language AI advice. It is not accounting software.
-
Profit and loss, month by month
Revenue, 14 cost lines in four groups, gross profit, net profit and net margin.
-
Budget vs actual
How much of each month's spending budget you used, and where you went over.
-
What needs attention
Losses, budget overruns and unusual costs, read straight off your figures.
-
Where it's heading
A trend through your net profit, and advice written by Claude when you ask for it.
Running a restaurant? The restaurant P&L dashboard page shows food cost, labor and prime cost, month by month.

Built for owners who read the numbers themselves
No account, no onboarding call and no formulas: the figures you already have, laid out so you can act on them.
- 01
Non-tech owners: plain labels and a ? beside every term. If you can copy a total from your Profit and Loss, you can use this.
- 02
International teams: see your figures in euros, pounds, dollars and more. Amounts written 1.250,00 or 1,250.00 are both read correctly.
- 03
Freelancers: one spreadsheet, a row per month, or photos of your invoices. Every month at a glance.
- 04
Small teams: your figures stay in your browser, or log in to have them on any computer.

From the demo dashboard · September 2026
Profit, costs and budget vs actual, month by month
Net margin
−11.0%A loss: costs ran past revenueTotal costs
$36,640Across 4 cost groupsBudget used
107.8%$2,640 over budget
Forecast example
See where it's heading, not just where it's been
FinDash draws the trend through your monthly profit. In the demo it turned down in August, a month before September's loss.
Net profit (demo)
Direction (next 3 months)
With fewer than six months on file you see the direction only. From six months, FinDash projects the next three in dollars, with a range.
-
01
Get the template
One row per month: revenue, budget and 14 cost lines, filled in with sample months so you can see the layout.
-
02
Fill in your numbers
Copy your monthly totals from QuickBooks, Xero or your own spreadsheet, or add photos of supplier invoices.
-
03
Add the file
Drop it on the dashboard and see each month's profit, costs and budget. It stays in your browser.
Check every delivery, know what to buy
We're building a short daily routine for food businesses: check a supplier invoice against what actually arrived, keep track of what's on the shelf, and see what needs buying next. In English and Chinese, keeping your supplier's own wording. Join the waitlist and you'll hear first.
A short daily routine for food businesses: check a supplier invoice against what actually arrived, keep track of what's on the shelf, and see what needs buying next. In English and Chinese, keeping your supplier's own wording.
Questions people ask
Is there a free profit and loss dashboard for small businesses?
Yes. FinDash is free, and the dashboard works without an account. Add a spreadsheet of your monthly totals to see each month's revenue, costs, gross and net profit, and how much of your budget you used.
Do I need QuickBooks or Xero to use FinDash?
No. Fill in FinDash's Excel or CSV template, or use your own layout: columns are matched by name, and a sheet with the months across the top is turned the right way round. If you use QuickBooks or Xero, copy each month's totals from your Profit and Loss report.
Is my spreadsheet uploaded anywhere?
No. Your spreadsheet is read and added up in your own browser. Only the things you ask for that need a server leave your computer: reading an invoice photo, writing advice, or saving your figures to a free account. The privacy policy lists exactly what is sent.
Can FinDash read a photo of a supplier invoice or receipt?
Yes, with a free account. Claude, an AI model, reads every line; FinDash checks the arithmetic against the printed total; and you confirm the lines before anything is added to your month.
What does budget used mean?
Your total costs as a share of the spending budget you set for the month. Over 100% means you spent more than you planned, and the month shows up under What needs attention.
What is the difference between gross profit and net profit?
Gross profit is revenue minus direct costs: cost of goods sold, labor, employee meals and payroll tax. Net profit is what is left after every cost, and net margin is net profit as a share of revenue.
Does FinDash show cash flow?
No. It shows profit: each month's revenue minus its costs. Cash can differ, for example when customers pay late or you buy stock ahead, so a profitable month can still leave you short of cash.
Does it work for restaurants, shops and trades?
Yes. FinDash was built for a restaurant, and its four cost groups work just as well for shops, trades, service businesses and freelancers. Figures can be in dollars, euros, pounds and other currencies.
Is FinDash accounting software?
No. It doesn't connect to your bank, keep your books, send invoices, take payments, run payroll or file taxes. It shows the figures you already have, clearly, so you can act on them.